Recently Sold • Alberta
Just Sold: Blackfalds Home Prices & Sale History
Browse recently sold listings in Blackfalds. See MLS® sold prices, days on hômm, and how much homes actually sell for.
Search Blackfalds neighbourhood sold data
Know the neighbourhood? Go straight to its sold-data page.
Homes sold in the last 30 days
19
Typical sale price
$415,000
Average time to sell
37 days
How much did that house sell for? In Blackfalds, we track every MLS® sale so you know exactly what buyers are paying. From bungalows to duplexes, condos to luxury homes — see sold prices across every property type.
This isn't guesswork. It's real MLS® sold real estate data. Use it to understand property values in Blackfalds, find comps for your neighbourhood, and estimate your own home's value.
Blackfalds Sold Data Overview
Over the past 2 years, 625 homes have sold in Blackfalds, with a median sold price of $389K. Sale prices have ranged from $95K to $844K. The typical home sells in 22 days, showing a balanced market. Homes are selling at 98.9% of their list price — very close to asking price. Median property taxes in the area run approximately $3,166 annually. The most common property types sold include Detached Single Family (404), Townhouse (114), Half Duplex (49).
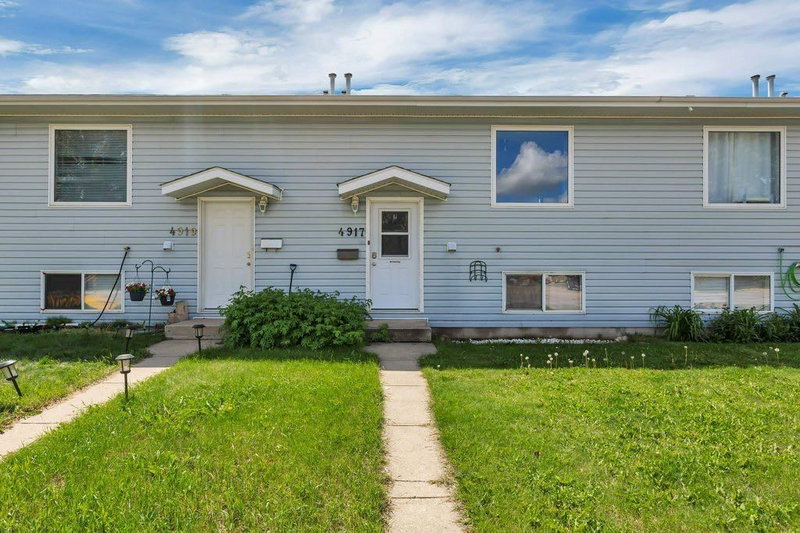
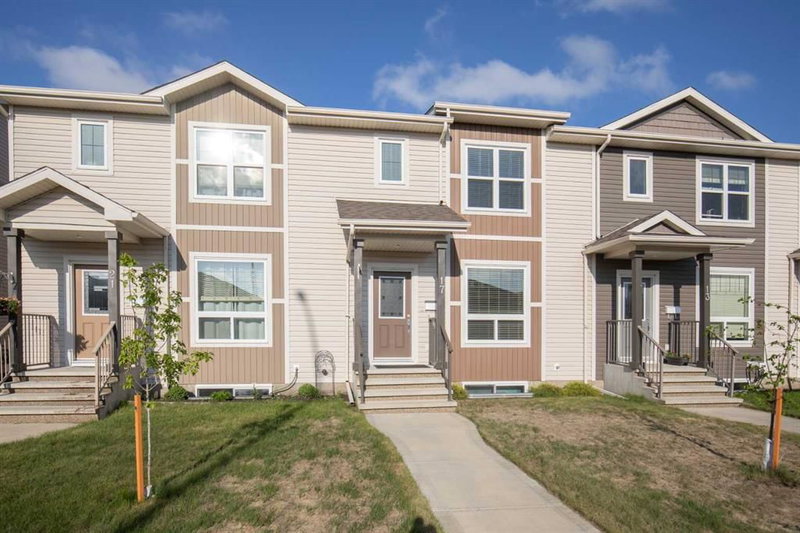
Recently Sold in Blackfalds
19 homes sold in the last 30 days. Showing 6 of 19 • Updated July 14, 2026 at 12:31 AM
View all 634 on the map
Create a free account to unlock the sold price, address, and sold date.
Unlock to see full address
Create a free account to unlock the sold price, address, and sold date.
Unlock to see full address

Create a free account to unlock the sold price, address, and sold date.
Unlock to see full address

Create a free account to unlock the sold price, address, and sold date.
Unlock to see full address
Create a free account to unlock the sold price, address, and sold date.
Unlock to see full address

Create a free account to unlock the sold price, address, and sold date.
Unlock to see full address
Curious what your home is worth in Blackfalds?
These recent sales tell you what buyers are paying. Get a free, data-backed estimate for your specific home in 60 seconds.
Sold Data & Market Statistics for Blackfalds
See how the market is performing — prices, how fast homes are selling, and whether buyers or sellers have the advantage.
$389,000
Avg: $402,910
Range: $95,000 – $844,000
98.9%
Homes selling near asking
43 days
$324
625 homes sold
Click a property type to view its trends in the chart below:
All Property Types
(click to filter chart)2-Year Market Trends: All Property Types
(25 months)Negotiation & Cost Insights
Sold Above Asking
17%
70% sold below
Median Property Tax
$3,166/yr
Avg: $3,157
Price Spread
±$124,241
standard deviation
625
Homes sold (last 2 years)
128
Currently for sale
6.7
Months of Inventory (MOI)
14.8%
Absorption Rate (30d)
42
New in July 2026
19 vs 35
Sold count (last 30 vs prior 30): -45.7%
Median price: $415,000 vs $396,000 (+4.8%)
Neighbourhood Sold Data
Browse recently sold homes by neighbourhood.
Explore houses for sale in Blackfalds
128 active MLS® listings · $422,450 median. See what's on the market today.
Frequently Asked Questions
Website provided by Kelly Grant
Data is supplied by Pillar 9™ MLS® System. Pillar 9™ is the owner of the copyright in its MLS® System. Data is deemed reliable but is not guaranteed accurate by Pillar 9™. The trademarks MLS®, Multiple Listing Service® and the associated logos are owned by The Canadian Real Estate Association (CREA) and identify the quality of services provided by real estate professionals who are members of CREA. Used under license.
Mortgage values are calculated by hômm and are provided for estimate purposes only.
The hômm Estimate is calculated by instantestimate.house and is provided as a general estimate only.
Trademarks are owned or controlled by the Canadian Real Estate Association (CREA) and identify real estate professionals who are members of CREA (REALTOR®, REALTORS®) and/or the quality of services they provide (MLS®, Multiple Listing Service®).
Listing information last updated on July 14, 2026 at 6:00 am (America/Edmonton)
Sign up to see what homes actually sold for
Create a free account to see final sale prices, days on market, and price history for recently sold homes in Blackfalds.
- See final sold prices, not just asking prices
- Compare your home to recent sales nearby
- Track market trends in your neighbourhood